Overview
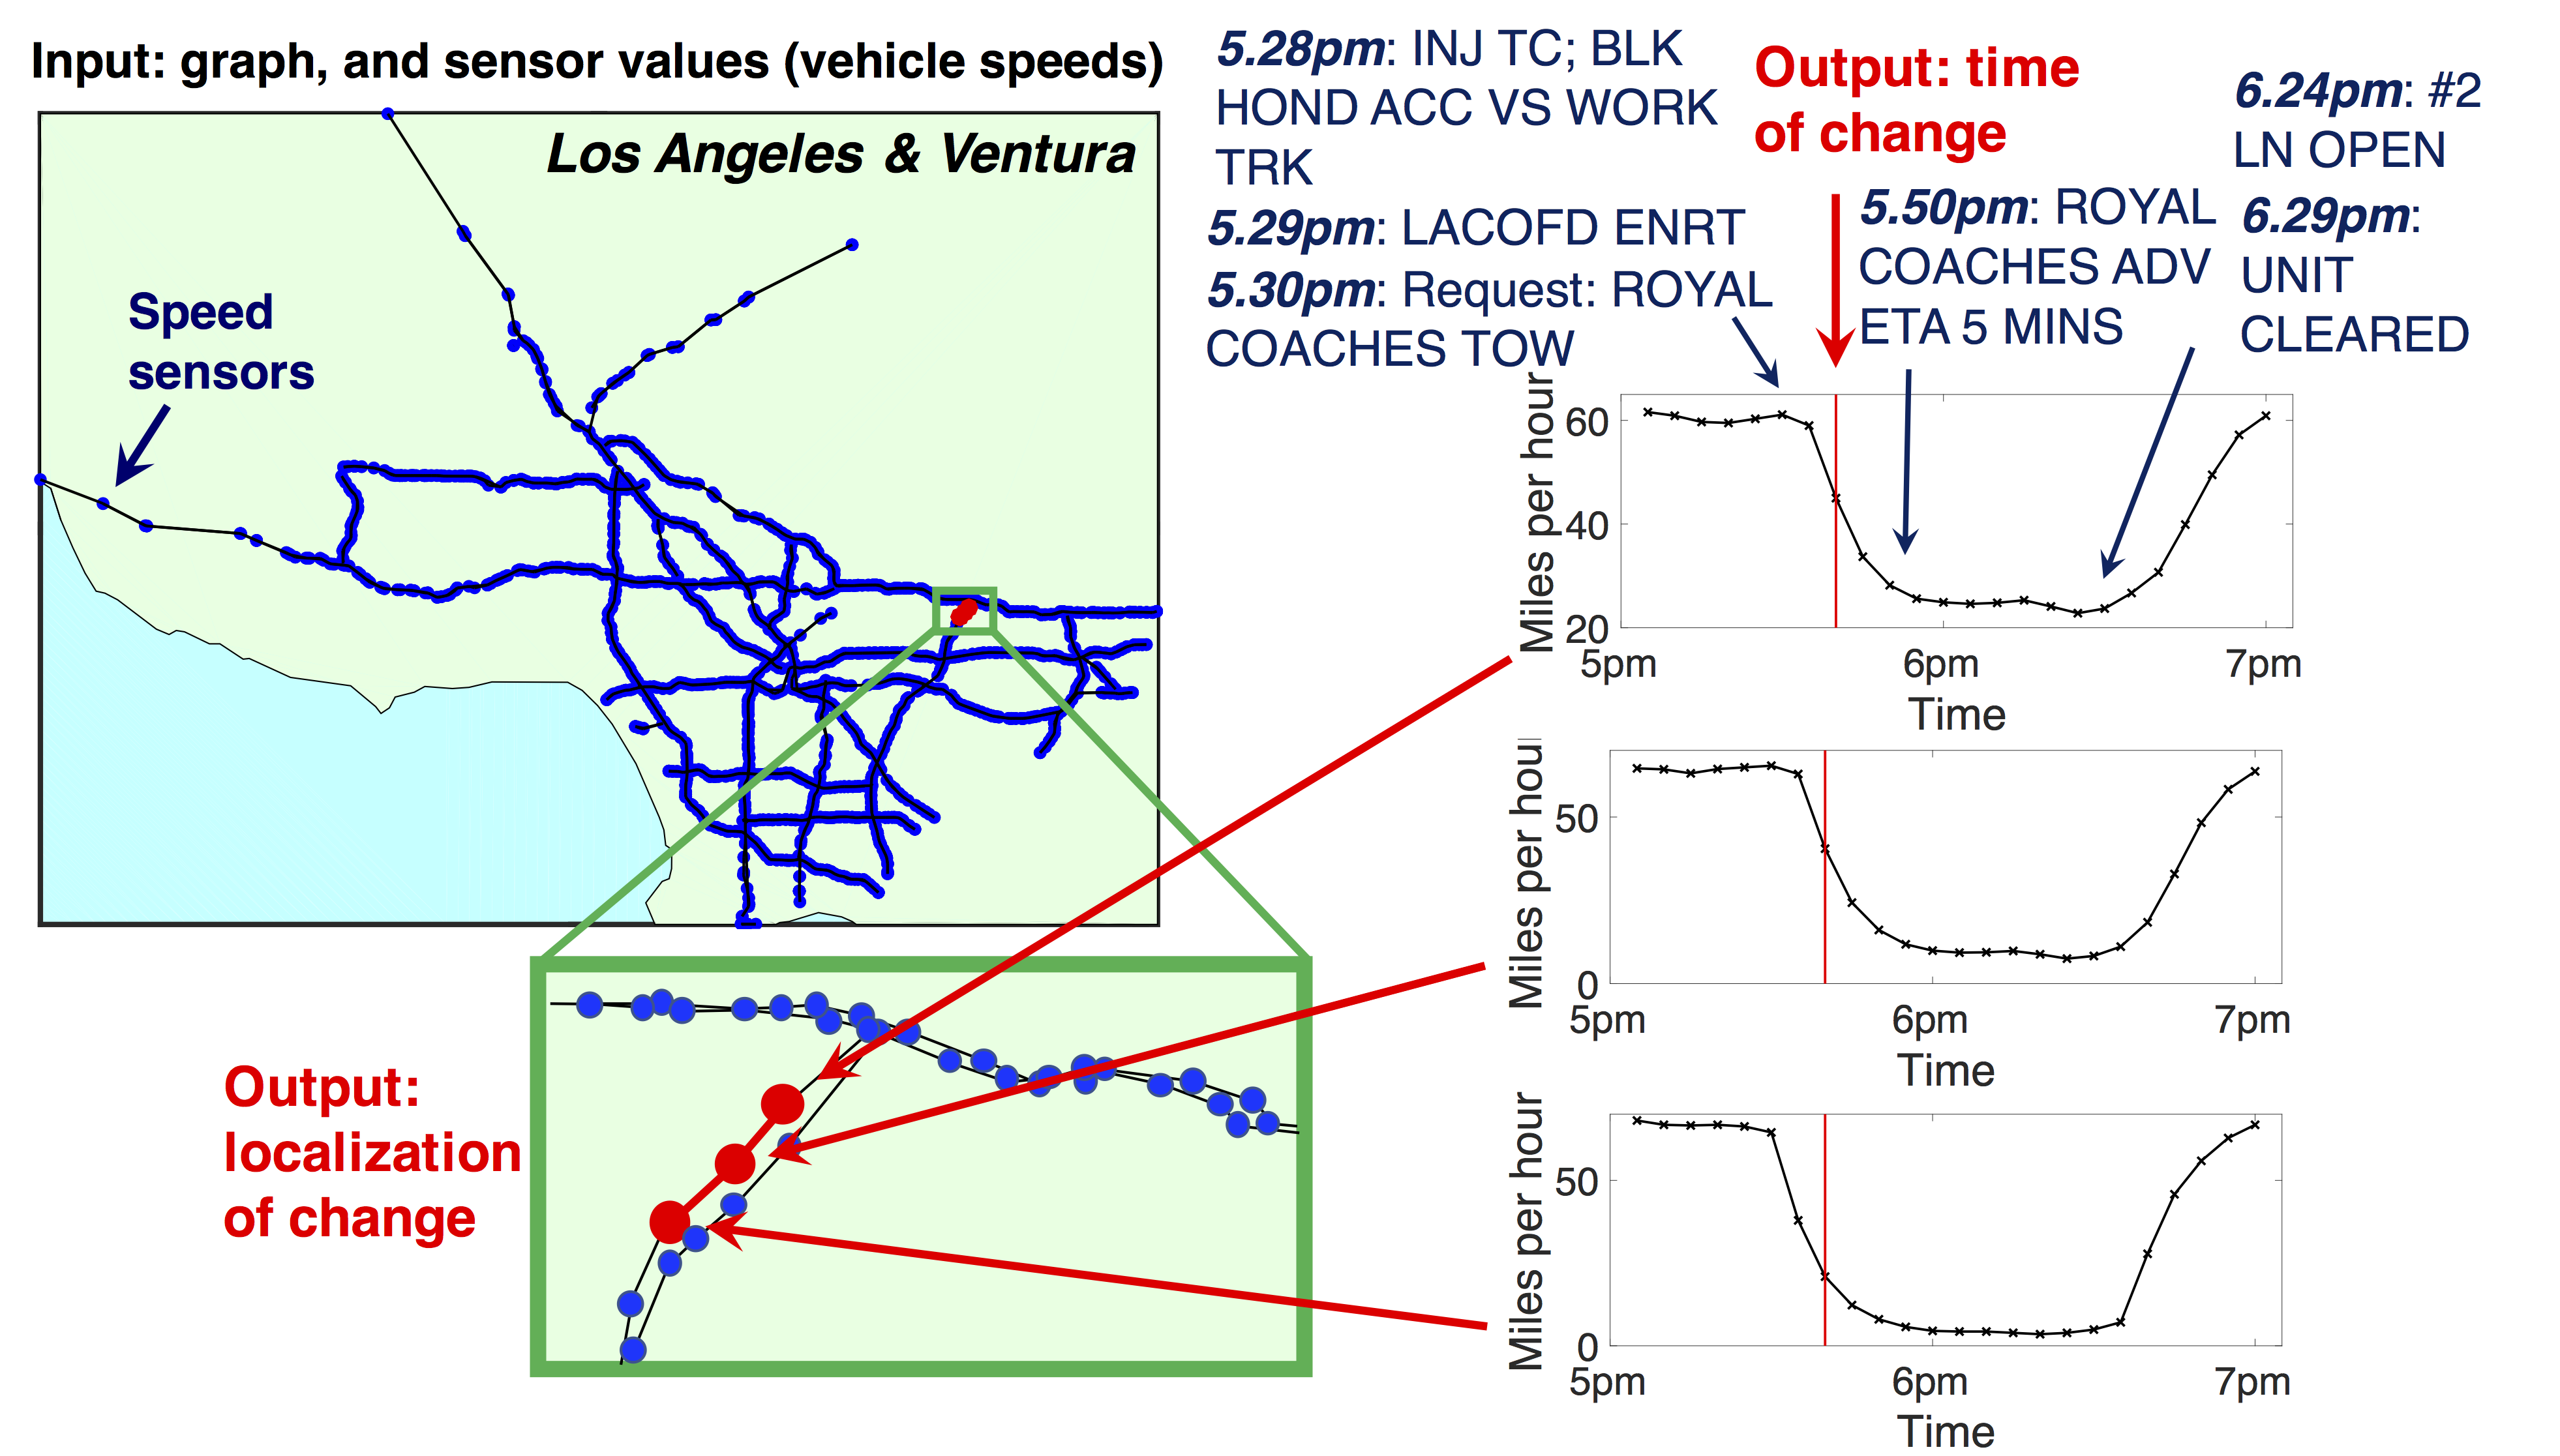
How do we detect change points using sensors placed on a subset of the nodes or edges of a graph? This has applications to detecting electrical failures in a power grid setting, and detecting traffic accidents or other events in road traffic graphs. ChangeDAR (Change Detection And Resolution) detects changes in an online manner, and reports when and where the change occurred in the graph. ChangeDAR has the following properties:- Scalable: it runs in near-linear time in the graph size and the number of time ticks.
- Online: it finds change points incrementally as new time ticks are received.
- Theoretical Guarantees: it provides constant-factor approximation guarantees.
Paper
The paper is at: [Download]. The supplementary document is at: [Download]Code
The source code and experiments used in the paper are available: [Download]Datasets
The power grid graphs we used are from the Matpower package: http://www.pserc.cornell.edu/matpower/.The resulting generated multivariate time series used in the paper are PolandHVN1, PolandHVN2, PolandHVN3, PolandHVN4. Each contains 4 time series (Ir, Ii, Vr, Vi) which are the 4 dimensional time series data (I=current, V=voltage, r=real, i=imaginary). They also contain fields for the anomaly locations: 'change_time' is the time of the anomalies, 'true_labels' is the same as change_time but in binarized form, and 'change_edges' is the edge location of the anomalies.
The traffic data can be found at PEMS: http://pems.dot.ca.gov/.